What Is Executive HR Analytics, Really — and What Isn’t It?
Executive HR analytics is not a reporting dashboard. It is not a quarterly slide deck assembled from manual exports. And it is not AI.
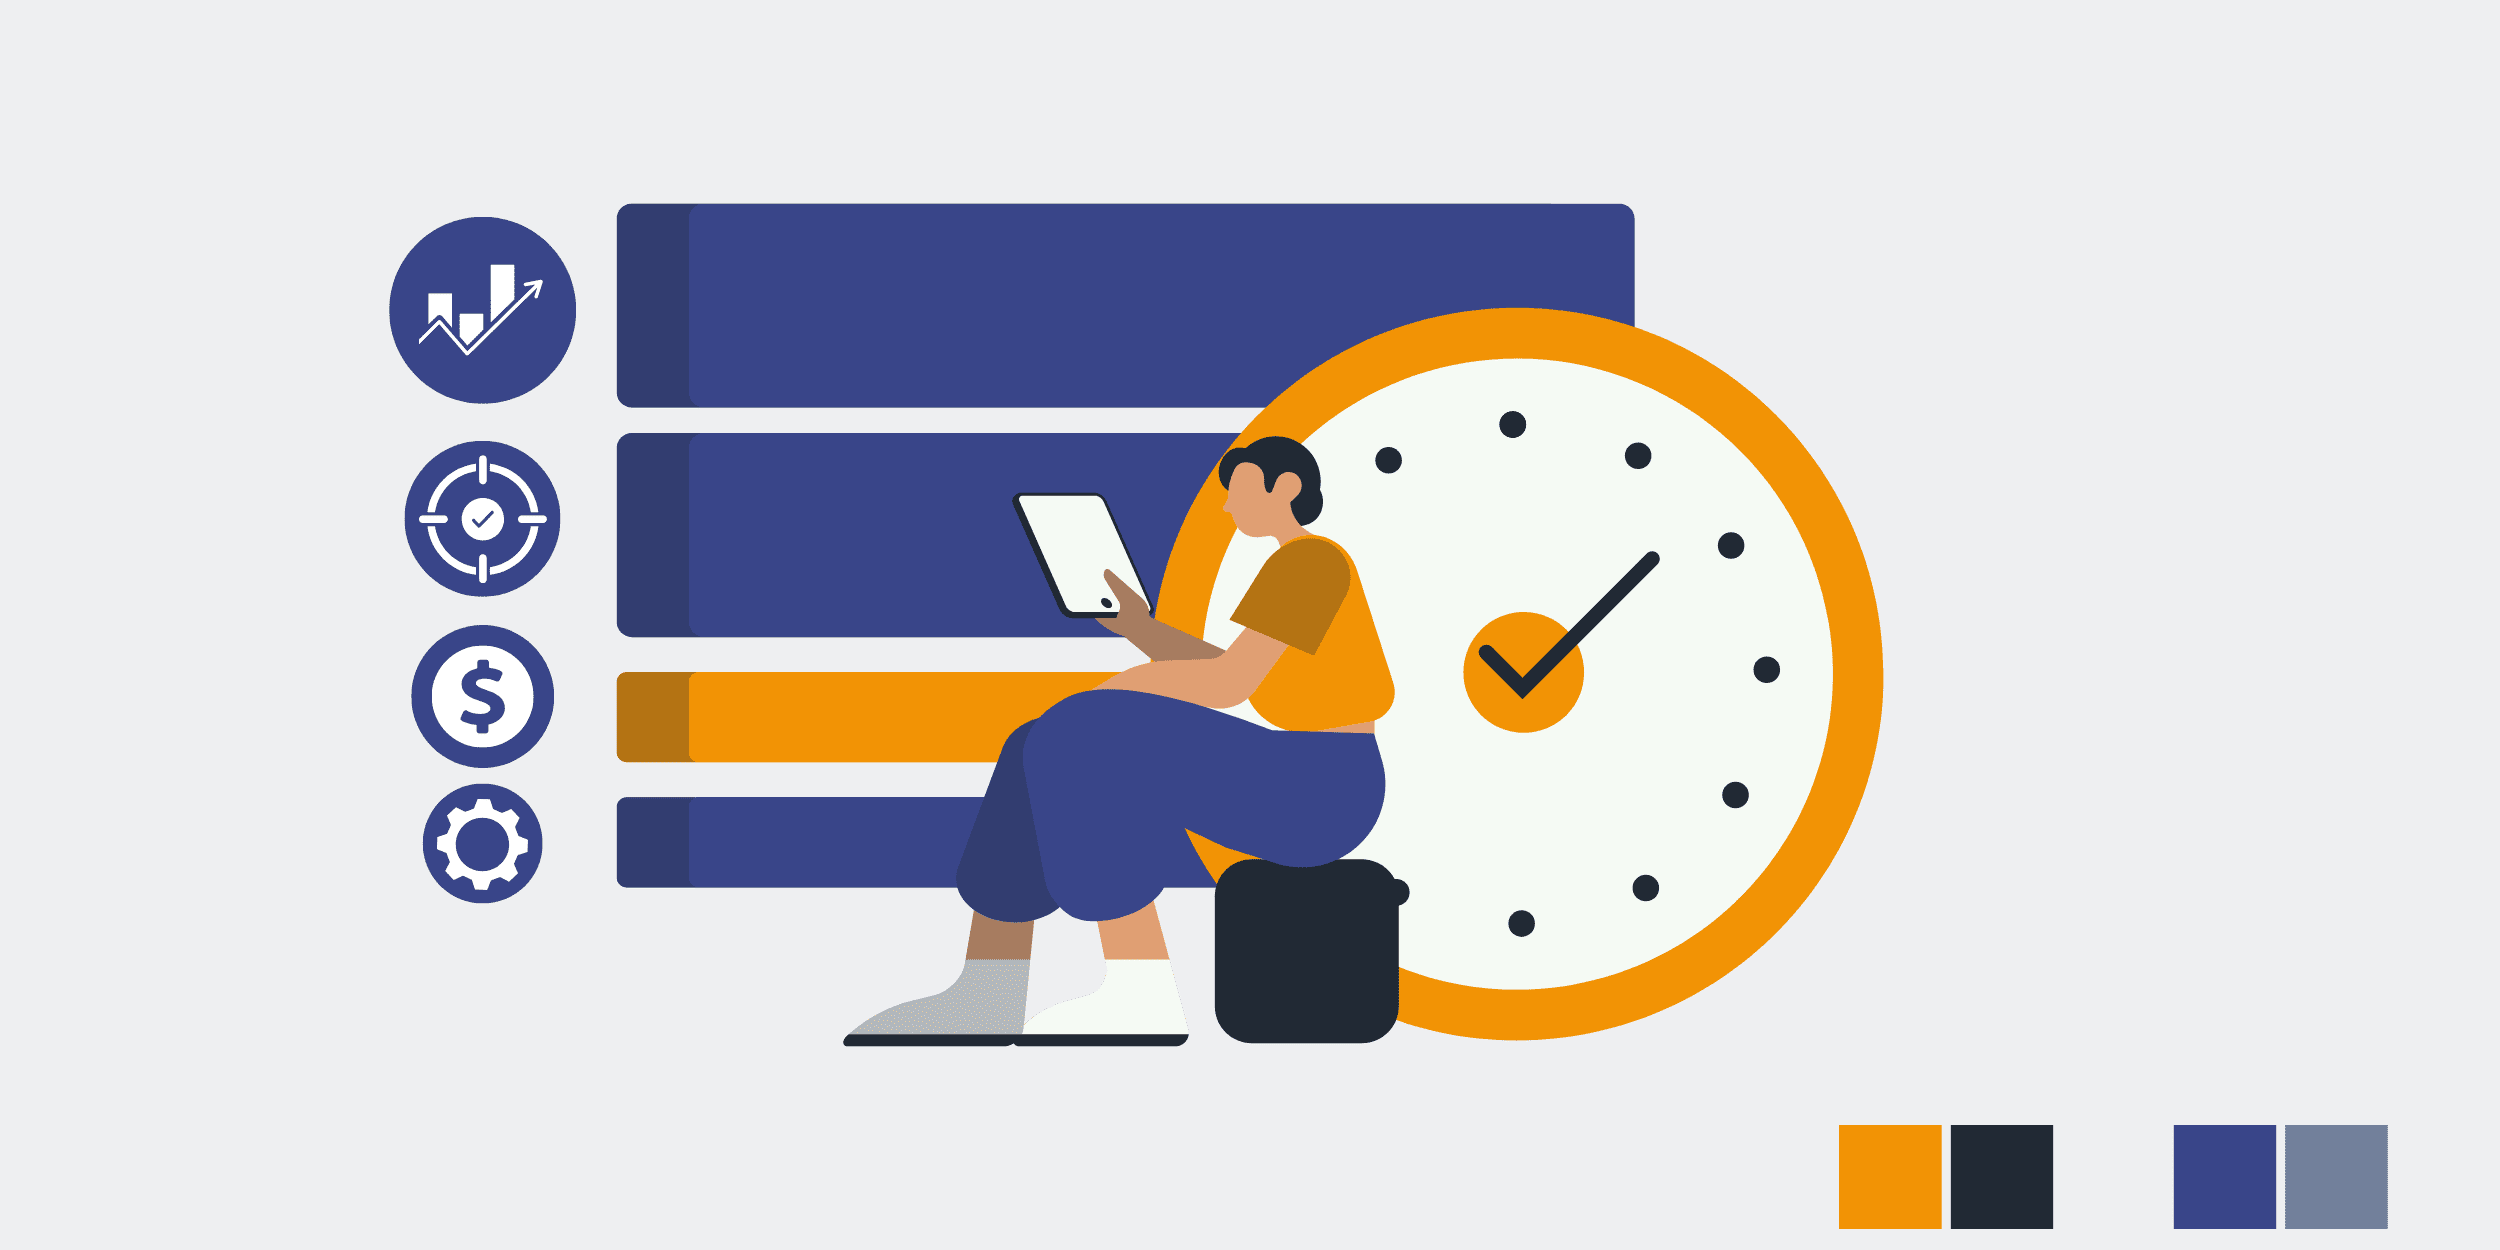
Executive HR analytics is the discipline of building automated data pipelines that deliver the right workforce metric to the right decision-maker at the moment that decision is being made. When the CFO asks about workforce cost trends during a planning meeting, the answer should already exist in a live dashboard fed by automated pipelines — not in a spreadsheet that an analyst will need two days to assemble. When the CEO asks whether the organization can absorb 20% growth without proportional headcount increases, the capacity model should update in real time from automated feeds, not from last quarter’s static assumptions.
AI is a judgment layer deployed inside those pipelines at specific points. Predictive attrition modeling uses AI because the pattern recognition across compensation trajectories, engagement signals, manager change frequency, and market conditions exceeds what a human analyst can process in a spreadsheet. Workforce anomaly detection uses AI because flagging that a department’s overtime patterns correlate with quality incidents requires cross-system pattern matching at a scale rules cannot handle. But the pipeline — the automated flow of clean, timestamped, validated data from every HR system to every executive dashboard — is not AI. It is infrastructure.
The practical consequence: if you deploy an AI-powered analytics platform before you have reliable, automated data flowing between your systems, the AI has no trustworthy inputs. The predictive model produces confident numbers built on inconsistent field definitions, duplicate records, and stale exports. The CEO presents those numbers to the board. An investor asks a follow-up question. The number does not hold. The credibility cost of that moment is not recoverable with a better algorithm. It is recoverable only with better infrastructure.
The 4Spot sequence is infrastructure first, then AI. Build the automated pipeline. Get every HR system feeding a single source of truth. Then deploy the judgment layer inside the pipeline where it adds value no rule can replicate.
Why Is HR Analytics Failing to Reach the Executive Table?
Most HR teams produce analytics that executives ignore. The reason is structural, not strategic — and no amount of data storytelling training will fix it.
Here is the pattern. The CHRO invests in a people analytics platform. The vendor promises executive dashboards, predictive insights, and workforce planning capabilities. The dashboards go live. The CHRO presents a turnover forecast to the executive team. The CFO pulls a different headcount number from the finance system. The CTO shows a third number from the engineering capacity tracker. Three systems, three answers, zero credibility. The analytics initiative is not wrong — it is untrusted. And untrusted analytics do not reach the executive table.
The root cause is the absence of an automated data spine. When workforce data lives in disconnected systems — the ATS holding candidate pipeline data, the HRIS holding employee records, the finance system holding compensation actuals, the LMS holding skills data — and the only thing connecting them is manual exports and spreadsheet reconciliation, every analytics output is an assertion rather than a fact. Assertions get challenged. Facts survive follow-up questions. The difference is infrastructure.
Gartner reports that 65% of HR leaders feel overwhelmed not by strategic challenges but by administrative tasks. SHRM data shows 42% of HR professionals cite burnout from repetitive manual tasks. When the analytics team spends 80% of its time assembling data and 20% analyzing it, the executive team receives late, stale, manually assembled metrics that cannot withstand scrutiny. Microsoft Work Trend Index data shows that 68% of people report having insufficient uninterrupted focus time during the workday. For HR analysts, the interruptions are data reconciliation requests from executives who do not trust the last report. The fix is not more focus time. It is an automated pipeline that produces numbers executives never need to question.
What Are the Core Concepts Executives Need to Know About HR Analytics?
Executive decision-makers do not need to understand the technical implementation. They need shared vocabulary that connects HR analytics to business outcomes — defined on operational terms, not vendor marketing.
Automated data pipeline is the infrastructure that connects every HR system to a single source of truth. It enforces field definitions, deduplicates records, validates data at point of entry, and timestamps every movement. When the pipeline works, every executive dashboard reads from the same authoritative source. No conflicting numbers. No reconciliation meetings.
Leading indicators predict future outcomes: engagement trend velocity, internal mobility rate, offer acceptance trajectory, skills gap closure rate, pipeline conversion by stage. Lagging indicators report what already happened: annual turnover rate, time-to-hire average, training completion percentage. Most executive HR decks consist almost entirely of lagging indicators because leading indicators require automated infrastructure to calculate in real time. The executive value of HR analytics is in the leading indicators — the metrics that inform decisions before outcomes are fixed.
Financial linkage is the explicit, auditable connection between a workforce metric and a business financial outcome. ‘Revenue per employee increased 12%’ is a financial linkage. ‘Employee engagement score: 4.2’ is not — unless you can trace the causal chain from engagement to productivity to revenue with data the CFO can audit. Building that chain requires automated pipelines from HR systems to financial reporting, not a correlation table in a strategy presentation.
Predictive analytics means deploying AI models inside the automated pipeline to forecast workforce outcomes — attrition probability, capacity shortfalls, compensation drift. The key word is inside. A one-time predictive analysis is a consulting deliverable. Predictive analytics inside an automated pipeline is a continuously updated decision tool that surfaces signals before they become problems.
Single source of truth means one authoritative record for every workforce data point. If the HRIS and the finance system produce different answers to ‘how many active employees do we have,’ you do not have a single source of truth — and every metric built on that data is suspect in the boardroom.
OpsMesh™ is the connective methodology that ensures every tool, workflow, and data point in the HR stack works together rather than alongside each other. For executive analytics, OpsMesh™ governs how data flows from source systems to executive dashboards with full auditability at every step.
What Does Poor HR Analytics Actually Cost the Organization?
The cost of unreliable HR analytics is not measured in analyst hours. It is measured in executive decisions made on wrong numbers, strategic plans built on stale assumptions, and organizational credibility lost in boardroom moments that do not offer second chances.
The 1-10-100 rule, originally proposed by Labovitz and Chang and documented by MarTech, defines the cost curve: $1 to verify a data point at entry, $10 to clean it downstream, $100 to fix the business decision made on corrupt data. For executive HR analytics, the $100 consequence operates at organizational scale. When the workforce planning model underestimates attrition by 15% because the data pipeline was stale, the executive team approves a hiring plan that is wrong before it starts. The cost is not the bad forecast — it is the six months of misallocated budget, the recruiting team chasing the wrong targets, and the operational gaps that surface when reality diverges from the plan.
David, an HR Manager at a mid-market manufacturing company, experienced the $100 consequence at individual scale. He manually re-keyed offer data between disconnected systems and entered $130,000 instead of the actual $103,000 offer. The $27,000 annual overpayment went undetected for three months. The employee eventually learned, then quit. David spent six months rebuilding trust with leadership. Research published in the International Journal of Information Management shows a baseline error rate of approximately 1% per field touched in manual data entry. At executive scale — across thousands of employee records, dozens of systems, and quarterly planning cycles — that 1% error rate compounds into strategic misinformation.
Gartner estimates poor data quality costs organizations $12.9 million per year on average. For HR specifically, Parseur reports that manual data entry costs American companies $28,500 per employee per year. Every dollar spent on manual data assembly for executive reports is a dollar not spent on the strategic workforce analysis that the executive team actually needs. The unfilled position cost adds further pressure: $4,129 per role at 42 days average vacancy. When workforce analytics cannot predict hiring demand accurately, positions open late, stay open longer, and the revenue impact compounds through every quarter the plan was based on stale data.
Where Does AI Actually Belong in Executive HR Analytics?
AI earns its place inside the analytics infrastructure at three specific points where deterministic rules fail and the pattern recognition required exceeds human analytical capacity.
Predictive attrition modeling. A rule-based system can flag employees past a tenure threshold or below market compensation. It cannot weigh the interaction between compensation trajectory, manager change frequency, engagement survey velocity, internal mobility attempts, team restructuring history, and external labor market signals to produce a 90-day attrition probability for a specific individual. AI inside a structured pipeline — one that delivers clean, timestamped, deduplicated data from every source system — can. That probability, surfaced in an executive dashboard alongside cost-of-replacement estimates, converts a lagging metric (turnover happened) into a leading metric (turnover is about to happen, here is the cost, here is the intervention window).
Workforce capacity forecasting. Projecting headcount needs against revenue forecasts, seasonal demand patterns, skills gap data, planned organizational changes, and historical productivity curves involves too many interacting variables for a static model. AI handles the multivariate forecasting. But the forecast is only as accurate as the data feeding it — which means automated pipelines from every system that holds workforce, financial, and operational data, all flowing into a single source of truth with consistent definitions.
Cost anomaly detection. Identifying that a business unit’s overtime costs are trending 40% above historical patterns while simultaneously showing declining output metrics — across systems that were never designed to share data — requires AI-level pattern recognition. The automation pipeline moves the data. AI finds the anomaly. The combination surfaces a cost problem weeks before it appears in the quarterly financial review, giving the executive team an intervention window that manual reporting would never provide.
Everything else in the executive analytics pipeline is better handled by deterministic automation. Data validation, field mapping, record deduplication, scheduled report generation, threshold alerts, and dashboard refresh — these are infrastructure tasks. Deploying AI where rules suffice adds cost, latency, and unpredictability. The 4Spot principle: automation handles the mechanics; AI handles the judgment. In executive HR analytics, AI touches roughly 15–20% of the pipeline. The other 80–85% is structured automation delivering consistent, auditable data to every executive surface.
What Operational Principles Must Every HR Analytics Build Include?
Three principles are non-negotiable. An executive analytics implementation that skips any of them produces numbers the C-suite will learn to ignore.
Back up before you migrate. Every data migration, every field mapping change, every system integration that modifies source data must be preceded by a full backup, stored separately, verified restorable. HR data is employment records, compensation history, and compliance documentation. When a field mapping error overwrites six months of performance data across the HRIS, the backup is the difference between a 30-minute restore and a months-long manual reconstruction that delivers stale data to every executive dashboard in the meantime.
Log what the automation does. Every automated action in the analytics pipeline must log what changed, when, the before state, and the after state. This is the mechanism that converts executive analytics from assertions into facts. When the CEO questions a workforce cost number, you trace it back through every transformation, every system hop, every calculation to its original source — in minutes, not days. Asana research shows that 60% of a knowledge worker’s day is spent on ‘work about work.’ For analytics teams, a disproportionate share of that is reconstructing how a number was produced. Logging eliminates reconstruction entirely.
Wire a sent-to/sent-from audit trail between systems. When data moves from the HRIS to the finance system to the executive dashboard, every payload must carry metadata identifying the sending system, receiving system, timestamp, and transformation applied. This audit trail is what makes executive analytics trustworthy. Without it, the CFO’s question — ‘where does this number come from?’ — triggers a manual investigation. With it, the answer is a traceable chain of custody from source system to dashboard.
These principles are not technical overhead. They are the operational foundation that determines whether the executive team treats HR analytics as authoritative input or background noise.
What Are the Highest-ROI HR Analytics Tactics for Executive Decision-Making?
Rank analytics investments by executive decision impact and dollar value — not by technical sophistication or dashboard aesthetics.
Automated workforce cost dashboard. Real-time visibility into total workforce cost — compensation, benefits, contractor spend, overtime, vacancy cost — broken down by business unit, role family, and trend. When this dashboard is automated, the CFO sees current state without requesting a report. When it is manual, the CFO sees last month’s state two weeks later. The automated version changes how workforce cost enters planning conversations: from a backward-looking report to a forward-looking input.
Predictive attrition alerting with cost overlay. Once the data pipeline is clean, layering a predictive attrition model that includes replacement cost estimates produces the highest-value executive analytics application. The model flags at-risk employees before they signal intent to leave and attaches a dollar figure: ‘This employee has a 73% attrition probability in the next 90 days. Replacement cost: $185,000. Retention intervention cost: $12,000.’ That framing converts a people problem into a financial decision the executive team can act on immediately.
Capacity planning model tied to revenue forecasts. Connecting workforce capacity data to revenue projections through an automated pipeline creates the workforce planning model that every CEO requests and almost no HR team can deliver in real time. The model answers: ‘Given projected revenue growth of 15% in Q3, do we have the capacity to deliver, and if not, what hiring must begin in Q1 to close the gap?’ Manual versions of this model are quarterly exercises. Automated versions are continuously updated decision tools.
Hiring pipeline velocity with financial impact. Automated tracking of pipeline conversion rates, time-in-stage, and projected fill dates — tied to the $4,129 average vacancy cost per role — gives the executive team real-time visibility into hiring risk. When a critical role has been in the interview stage for 30 days with no movement, the dashboard flags the financial exposure before the quarterly review surfaces it as a surprise.
How Do You Identify Your First HR Analytics Automation Candidate?
Apply the two-question filter: does the executive data request happen frequently, and is assembling the answer currently a manual process? If yes to both, automate that data flow first.
For most organizations, the first candidate is the headcount and workforce cost reconciliation between the HRIS and the finance system. This is the data that enters every executive planning conversation. When it is manually assembled — exported from the HRIS, manipulated in a spreadsheet, cross-referenced with finance actuals — it arrives late, carries manual errors, and produces numbers the CFO has learned to distrust. Automating this single pipeline creates the foundation for every downstream executive metric.
The second candidate is typically the turnover and attrition data feed. McKinsey Global Institute research shows that 40% or more of workers spend at least a quarter of their workweek on repetitive tasks. For HR analytics teams, turnover reporting is the most frequent repetitive request — monthly, sometimes weekly, and every time with a different slicing requirement (by department, by tenure band, by performance rating). Automating the data feed from HRIS to the analytics layer means every slice is available on demand without manual assembly.
Sarah, an HR Director at a regional healthcare organization, spent more than 12 hours per week on interview scheduling — time that was invisible to the executive team because it produced no analytics output. After automating the scheduling workflow, she reclaimed six hours per week. But the executive analytics impact was the real transformation: with scheduling data flowing automatically into the pipeline, Sarah’s team could finally report time-to-hire, cost-per-hire, and candidate experience metrics in a format the executive team used in planning meetings. The automation did not just save time — it created the data that made executive analytics possible.
Start with headcount reconciliation. Prove value in two to four weeks with an OpsSprint™. Then move to attrition reporting. The compound effect is that two automated feeds create the foundation for every capacity planning and cost forecasting model the executive team will ever request.
How Do You Make the Business Case for HR Analytics to the C-Suite?
The business case for executive HR analytics must be made in the language executives already use: cost avoidance, risk reduction, and decision speed. Not dashboard features. Not data visualization capabilities. Not AI.
Cost avoidance. Every manual data assembly process carries error risk at approximately 1% per field touched. Across an organization producing monthly workforce reports from multiple systems, the cumulative error exposure is quantifiable. David’s $27,000 payroll overpayment from a single manual re-key error is one data point. Multiply that risk across every manual data transfer in the analytics pipeline, every month, and present the annual exposure. Then present the cost of automating those transfers. The math makes itself.
Decision speed. When the executive team requests a workforce metric, how long does it take to deliver an answer? If the answer is ‘days,’ the organization is making decisions in the gap — with assumptions, estimates, or last quarter’s numbers. Automating the pipeline converts ‘days to assemble’ into ‘already in the dashboard.’ The value of that speed is measured in the quality of decisions the executive team makes during planning cycles, M&A due diligence, restructuring, and crisis response.
Risk reduction. The 25–30% of HR professional time spent on automatable tasks is time not spent on the compliance, governance, and strategic analysis that protects the organization. SHRM reports that 74% of HR professionals feel overwhelmed by administrative workloads. When the analytics team is buried in data assembly, compliance risks go unmonitored, workforce planning models go unupdated, and the executive team operates on stale information.
The OpsMap™ provides the framework for this business case. It quantifies the specific automation and analytics opportunities, maps dependencies, and produces a prioritized roadmap with dollar estimates. The OpsMap™ carries a 5x guarantee: if it does not identify at least 5x its cost in projected annual savings, the fee adjusts. That guarantee converts the business case from a speculative investment into a bounded-risk assessment with a contractual floor.
How Do You Implement Executive HR Analytics Step by Step?
Every executive HR analytics implementation follows the same structural sequence. Skipping steps creates the inconsistent data that undermines executive trust — the exact problem the initiative was designed to solve.
Step 1: Back up everything. Full backup of every system that will be connected — HRIS, ATS, finance, LMS, performance management. Stored separately. Verified restorable.
Step 2: Audit the current analytics workflow. Document every executive data request from the past 12 months. Map how each request was fulfilled: which systems were queried, what manual steps were required, how long it took, and whether the delivered number was ever challenged or contradicted. This audit reveals the true state of executive analytics infrastructure — which is almost always more manual, slower, and less reliable than anyone on the leadership team realizes.
Step 3: Map source-to-target fields across all systems. For every data point that will flow through the analytics pipeline, define the source field, target field, transformation rule, and validation criteria. When ‘department’ in the HRIS means cost center but ‘department’ in the finance system means P&L owner, the field mapping resolves that permanently. Every conflicting number the executive team has ever seen originated in an unmapped field definition.
Step 4: Clean before migrating. Deduplicate records, resolve conflicting field values, standardize formats. The 1-10-100 rule applies: cleaning now costs $1 per record. Cleaning after the executive team has seen a report based on dirty data costs $100 in credibility.
Step 5: Build the pipeline with logging and audit trails. Construct the automated data flow with logging at every node — what changed, when, before/after state, sending system, receiving system. This logging is not technical overhead. It is the evidence chain that makes every number in every executive dashboard defensible.
Step 6: Pilot with the highest-frequency executive request. Run the automated pipeline for the single most frequently requested executive metric — typically headcount or workforce cost. Verify that the automated output matches the manually assembled output. Present both to the executive team. When the numbers match and the automated version arrives in seconds instead of days, the value proposition demonstrates itself.
Step 7: Expand to the full executive analytics surface. Add data feeds for attrition, hiring pipeline, compensation, capacity planning, and any domain-specific metrics the executive team uses. Each feed follows the same pattern: field mapping, validation, logging, audit trail.
Step 8: Layer AI at the judgment points. Only after the pipeline produces consistent, auditable data across all executive surfaces do you deploy AI. Start with predictive attrition modeling — the highest-value executive AI application. Monitor the model against actual outcomes for 60–90 days before integrating AI-generated forecasts into executive dashboards.
What Does a Successful HR Analytics Engagement Look Like in Practice?
The TalentEdge engagement demonstrates the full arc from disconnected data to executive-grade analytics — infrastructure first, AI second, with measurable outcomes at every phase.
TalentEdge is a 45-person recruiting firm with 12 recruiters, 5 sales staff, and 28 support and administrative employees. Before the engagement, workforce data lived across five or more platforms with no single source of truth. Leadership could not answer basic questions — cost per placement, recruiter productivity by channel, time-to-fill by role type — because the data was scattered across disconnected systems. Executive meetings ran on estimates, anecdotes, and last quarter’s manually assembled slide deck.
The engagement followed the OpsMap™ → OpsBuild™ sequence. The OpsMap™ audit identified nine automation opportunities across sourcing, resume processing, candidate communication, client onboarding, and executive reporting. Each opportunity was scored by dollar impact, hours recovered, and — critically — executive visibility created: how much decision-quality data each automation would produce as a byproduct of running.
The multi-month OpsBuild™ implemented all nine automations with the operational principles embedded: backup before every migration, logging at every node, sent-to/sent-from audit trails on every cross-system data movement. AI was deployed at two specific judgment points: resume parsing and tagging (free-text interpretation) and candidate-job matching (multivariate pattern recognition).
Results: $312,000 in annual savings. 207% ROI in 12 months. Recruiter sourcing time reduced by 85%. The firm scaled without adding headcount. But the executive analytics outcome was the transformation that mattered most to leadership: for the first time, TalentEdge had real-time executive dashboards showing recruiter productivity, pipeline velocity, cost-per-placement, and revenue attribution by source channel — all calculated automatically from the same data the automations produced. The metrics were trustworthy because they were byproducts of the automated pipeline, not manually assembled reports.
What Are the Common Objections to HR Analytics and How Should Executives Think About Them?
Every executive HR analytics initiative encounters the same objections. Here is how to address them with evidence the C-suite respects.
‘Our data is too messy to automate.’ Your data is messy because it is not automated. Manual data movement produces a baseline error rate of approximately 1% per field touched. Automation with point-of-entry validation produces clean data as a consequence of running. The data cleanup is not a prerequisite for analytics automation. It is a result of it. The OpsMap™ audit includes a data quality assessment that identifies exactly what needs to be cleaned before migration and what the automation will clean going forward.
‘We invested in a people analytics platform and it didn’t deliver.’ The platform is not the problem. The data feeding it is the problem. A people analytics platform connected to disconnected, manually maintained source systems produces the same inconsistent numbers faster. The missing layer is the automated pipeline between source systems and the analytics platform — with field mapping, validation, deduplication, and audit trails. That layer is what 4Spot builds.
‘The executive team doesn’t use HR data.’ The executive team does not use HR data they do not trust. Build the automated pipeline. Produce numbers that survive the CFO’s first follow-up question. Present those numbers consistently, in financial language, tied to business outcomes. The executive team will use HR data when the data earns its place in the decision. The shift from ignored reports to executive decision input is an infrastructure change, not a storytelling change.
‘AI will make our HR team irrelevant.’ No. AI replaces specific judgment tasks inside the analytics pipeline — pattern recognition across variables that exceed human capacity. It does not replace the people who design the measurement framework, interpret the results for executive context, translate data into organizational strategy, and manage the human dynamics that no algorithm touches. Every documented 4Spot engagement has held headcount flat or grown it.
What Are the Next Steps to Move From Reading to Building?
The OpsMap™ is the entry point. It is a strategic audit that identifies the highest-ROI analytics and automation opportunities in your HR operation, maps the dependencies between systems, estimates the savings, and produces a prioritized implementation roadmap with timelines and an executive buy-in plan.
The OpsMap™ output is not a generic recommendation deck. It is a scored, sequenced list of specific automation and analytics opportunities — each with estimated hours recovered, dollar impact, and executive visibility created. It identifies which data pipelines need to be built first, which AI applications are ready for deployment (because the data infrastructure supports them), and which should wait until the spine is in place.
From the OpsMap™, the path branches. An OpsSprint™ takes a single high-impact data pipeline from kickoff to live automation in two to four weeks — typically the headcount reconciliation or attrition data feed. An OpsBuild™ implements the full executive analytics infrastructure over six to twelve months, following the OpsMap™ sequence. OpsCare™ provides ongoing optimization, monitoring, and expansion after the build is complete.
The 5x guarantee applies to the OpsMap™: if the audit does not identify at least 5x its cost in projected annual savings, the fee adjusts. That guarantee means the first step carries bounded risk and a contractual floor on identified value.
For executive teams that have read this guide and recognized their organization in the failure patterns described: the analytics infrastructure is not going to build itself. Every month of manual data assembly is another month of executive decisions made on stale information, workforce plans built on untrusted numbers, and strategic value that HR delivers but cannot prove. The gap between what HR contributes and what executives can see is a pipeline problem. And pipeline problems have pipeline solutions.
Stop presenting manually assembled HR metrics that no one trusts. Start building the infrastructure that delivers executive-grade workforce intelligence automatically. Book an OpsMap™ and find out what your HR data is worth when the pipeline works.


