
Post: 9 Data Analytics Tactics for Smarter Candidate Sourcing in 2026
Sourcing budgets fail when teams measure application volume instead of hire quality. These nine data analytics tactics — from end-to-end attribution modeling to predictive quality scoring — give recruiting teams the evidence infrastructure to eliminate wasted spend and compound results over time.
| Tactic | Primary Metric | Implementation Effort | Impact Level |
|---|---|---|---|
| Source-of-Hire Attribution | Offer acceptance by channel | Medium | High |
| Cost-Per-Quality-Hire Scoring | Spend ÷ 90-day pass rate | Medium | High |
| 1-10-100 Data Quality Rule | Source tag completeness | Low | Critical |
| Funnel Drop-Off Mapping | Stage conversion rates | Low | Medium |
| Predictive Quality Score | Historical hire outcome match | High | High |
| Time-to-Productivity Tracking | Days to full output by source | Medium | Medium |
| Passive Pipeline Analytics | Outreach-to-response rate | Low | Medium |
| Diversity Funnel Mapping | Representation by stage | Medium | High |
| Sourcing Velocity Indexing | Days per pipeline stage | Low | Medium |
Sourcing budgets are wasted at scale when recruiting teams pour spend into channels that generate application volume but deliver almost no hires — and continue doing it because they lack the data infrastructure to see the problem clearly. The fix is not more budget. It is better measurement. These nine tactics connect every sourcing decision to evidence so your team stops guessing and starts compounding results.
This post drills into the sourcing analytics layer of the broader framework covered in our guide to AI-powered smarter sourcing and screening, and pairs directly with the execution work described in the AI automation advantage in candidate sourcing. For context on how data quality connects to broader HR operations risk, see HRIS required fields vs. manual data validation.
1. Build a Source-of-Hire Attribution Model That Tracks to Offer Acceptance
Most source-of-hire tracking stops at the application. That is the wrong finish line.
What it is
A structured attribution system that records which channel first exposed a candidate to your role, then tracks that candidate all the way through offer acceptance and 90-day retention.
Why it matters
A job board generating 500 applications and 1 hire performs worse than an employee referral program generating 30 applications and 12 hires. You cannot see that without end-to-end attribution. Volume metrics hide this gap entirely.
How to implement
- Add a mandatory “first source” field in your ATS at candidate creation.
- Automate the tag using UTM parameters on every job link.
- Audit the field monthly for completeness — incomplete records corrupt downstream reports.
The data trap to avoid
Do not let recruiters backfill source data from memory. It introduces systematic bias toward channels they personally prefer, not channels that actually perform.
Expert Take
SHRM research consistently identifies employee referrals as producing the highest quality-of-hire at the lowest cost-per-hire. But that benchmark is a starting point, not a verdict. Test it against your own attribution data before reallocating budget — your role mix, compensation structure, and employer brand all shift the result.
Bottom line: Attribution modeling at offer acceptance is the single highest-leverage analytics investment a sourcing team can make. Every other tactic on this list depends on it being in place.
2. Score Sourcing Channels by Cost-Per-Quality-Hire, Not Cost-Per-Application
Cost-per-application is a vanity metric that actively misleads budget decisions.
What it is
A composite channel efficiency score that weights application cost by the probability that an applicant from that source reaches offer stage and passes a 90-day performance threshold.
The calculation
Total channel spend ÷ number of hires who pass 90-day review = cost-per-quality-hire. Run this quarterly by channel and by role family. Monthly for high-volume roles.
What changes when you adopt this metric
- Premium job boards that charge per application often look expensive — because they are.
- Niche communities, alumni networks, and employee referrals appear dramatically cheaper when quality-weighted.
- Budget conversations shift from volume defense to ROI defense.
Data required
90-day manager performance ratings linked back to hire records by source channel. This connection is rarely built by default in standard ATS configurations — it requires deliberate setup.
The TalentEdge engagement — which produced $312K in annual savings and a 207% ROI — traced a significant portion of those savings directly to eliminating spend on sourcing channels that had never produced quality hires. The data had always been available. No one had connected it to channel decisions until quality-weighted scoring was in place.
Bottom line: Switching from cost-per-application to cost-per-quality-hire reallocates 20–35% of sourcing budget toward channels that actually produce retained employees. The calculation takes one afternoon to build. The reallocation compounds every quarter.
See also: Recruiting Automation: Transforming Hidden Costs into Measurable ROI.
3. Apply the 1-10-100 Data Quality Rule Before Every Analytics Project
Bad data does not just produce wrong answers. It produces confidently wrong answers — the worst possible outcome for budget decisions.
What it is
The 1-10-100 rule holds that preventing a data error costs one unit of effort, correcting it after the fact costs ten, and acting on corrupted data costs one hundred. In sourcing analytics, the error class is almost always incomplete or inconsistent source tagging.
The most common sourcing data errors
- Source field left blank or marked “other” by default.
- Multiple naming conventions for the same channel (“LinkedIn,” “LI,” “linkedin.com”).
- Agency hires attributed to direct sourcing because the ATS entry was created by a recruiter rather than the agency portal.
- Referral source not captured because no formal referral tracking field exists.
The fix
Audit your ATS source field for the last 12 months. Calculate the percentage of records with a valid, normalized source tag. If it is below 85%, your attribution reports are unreliable regardless of how sophisticated your analysis becomes.
This connects directly to the data validation problem documented in HRIS required fields vs. manual data validation. The same structural vulnerabilities that cause payroll errors cause sourcing data corruption — and the same required-field disciplines fix both.
Bottom line: Data quality is not an IT problem. It is a process design problem. Fix the intake before you build the dashboard.
4. Map Funnel Drop-Off Rates by Stage to Find Where Candidates Disengage
Drop-off is information. Most sourcing teams treat it as inevitable attrition instead of diagnostic data.
What it is
A stage-by-stage conversion rate analysis that identifies where candidates leave the pipeline and whether the exit rate differs by source channel, role type, or hiring manager.
The three questions funnel mapping answers
- Are candidates dropping off before the phone screen because job descriptions are inaccurate?
- Are they disengaging after the phone screen because the process takes too long?
- Are offers being declined at a higher rate from certain channels — indicating a compensation or expectation mismatch specific to that source?
Implementation
Pull stage-transition data from your ATS for the last six months. Calculate conversion rates at each stage. Segment by source channel. Look for statistical outliers — stages where one channel’s drop rate is more than 15 percentage points higher than the average.
For context on how broken hiring processes produce candidate frustration signals that show up in funnel data, see How HR Can Fix Broken Hiring Processes.
Bottom line: Funnel drop-off mapping tells you where your process is failing candidates before they tell you with silence.
5. Build a Predictive Quality Score Using Historical Hire Outcome Data
Predictive scoring shifts sourcing from reactive to proactive — but only when the historical data foundation is solid.
What it is
A scoring model that weights candidate attributes — source channel, role pathway, assessment results, interview stage reached — against historical outcomes for hires with similar profiles. The output is a probability estimate for reaching 90-day performance thresholds.
What you need before you build it
- At least 18 months of hire records with source attribution.
- Linked 90-day performance ratings from managers.
- Normalized job family taxonomy so you are comparing like roles to like roles.
The honest limitation
Predictive quality scores reflect historical bias as well as historical signal. If your past hiring systematically underrepresented certain groups, the model will encode that pattern unless you audit it deliberately. Build in a bias review before deployment.
Expert Take
Predictive scoring works best as a prioritization tool, not a gatekeeping tool. Use it to help recruiters focus outreach on channels and profiles with strong historical performance — not to automatically screen out candidates who fall below a threshold. The human review layer is not optional.
Bottom line: A well-built predictive quality score reduces time spent on low-probability candidates and concentrates recruiter effort where historical evidence says returns are highest.
6. Track Time-to-Productivity by Source Channel, Not Just Time-to-Fill
Time-to-fill measures how fast you close a requisition. Time-to-productivity measures how fast the hire actually delivers value. These are different numbers — and the second one is more important.
What it is
A measurement of the number of days from start date to the point where a new hire reaches full independent output, segmented by source channel.
Why the channel segmentation matters
Hires from employee referrals frequently reach full productivity faster than hires from job boards — because referred candidates have pre-existing context about the role, team, and culture. That difference rarely shows up in time-to-fill data, but it shows up clearly in time-to-productivity tracking when the data is connected.
How to measure it
Define “full productivity” operationally for each role family in collaboration with hiring managers. Track days from start date to that threshold. Link the record back to source channel in your ATS. Run a quarterly comparison across channels.
Bottom line: A hire who reaches full productivity two weeks faster than the channel average is worth more than time-to-fill metrics capture. Build the measurement so you can see it.
7. Build Passive Pipeline Analytics to Measure Outreach Effectiveness Before Applications Exist
Passive sourcing generates data before a single application is submitted. Most teams ignore that data entirely.
What it is
A structured tracking system for outreach campaigns to passive candidates — recording message volume, response rate, profile-to-response conversion, and downstream progression into active pipeline.
The metrics that matter
- Outreach-to-response rate: What percentage of candidates reply to initial contact?
- Response-to-screen rate: What percentage of respondents agree to a phone screen?
- Screen-to-pipeline rate: What percentage of screens convert to active candidates?
- Pipeline-to-offer rate: What percentage of passive candidates who enter the pipeline reach offer stage?
Why this matters for budget decisions
Passive sourcing through LinkedIn Recruiter or direct outreach carries a real labor cost even when the platform fee is fixed. If your outreach-to-response rate is 4% and your response-to-screen rate is 20%, you need 125 outreach contacts to produce one phone screen. Knowing that number tells you whether passive sourcing is cost-competitive with inbound channels for a given role type.
For a broader look at how automation infrastructure supports passive sourcing at scale, see AI and Automation: Unlocking Deeper Talent Pools Beyond CRM.
Bottom line: Passive pipeline analytics make the invisible labor cost of outreach-based sourcing visible — and comparable to inbound channel costs on an apples-to-apples basis.
8. Map Diversity Funnel Data by Stage to Identify Where Representation Gaps Are Created
Diversity sourcing failures are almost never sourcing failures. They are funnel failures at specific stages that sourcing data can identify precisely.
What it is
A stage-by-stage analysis of candidate representation across demographic dimensions, tracking where drop-off rates diverge from the overall pipeline average for specific groups.
What the data reveals
Teams that run this analysis frequently discover that representation at the top of the funnel is acceptable — but drops sharply at the phone screen stage or the hiring manager review stage. That pattern points to a screening problem or a manager bias problem, not a sourcing problem. Spending more on diverse sourcing channels will not fix a screening process that systematically filters out underrepresented candidates.
Implementation requirements
- Voluntary self-identification data collected at application with clear privacy disclosure.
- Stage-level reporting configured in your ATS or layered on top via export.
- Quarterly review cadence with hiring managers and recruiting leadership.
For compliance context on AI-assisted screening and diversity analytics, see 9 EEOC AI Compliance Requirements HR Teams Must Meet in 2026.
Bottom line: Diversity funnel mapping moves the conversation from sourcing spend to process integrity — which is where the actual problem almost always lives.
9. Build a Sourcing Velocity Index to Measure Speed-to-Pipeline by Channel
Velocity data tells you which channels get candidates into active consideration fastest — a metric that matters most for hard-to-fill roles with short hiring windows.
What it is
A per-channel measurement of average days from candidate identification to first meaningful pipeline stage (phone screen or hiring manager review), tracked separately from overall time-to-fill.
Why it is distinct from time-to-fill
Time-to-fill includes hiring manager scheduling delays, offer negotiation time, and background check duration — none of which are sourcing variables. Velocity indexing isolates the sourcing contribution to pipeline speed and makes it comparable across channels.
The operational insight this produces
A channel with high quality-per-hire scores but low velocity creates a different problem than a channel with fast velocity but low quality. Knowing both dimensions lets you make channel decisions based on role urgency — using fast-velocity channels for critical immediate needs and quality-weighted channels for planned hiring where you have lead time.
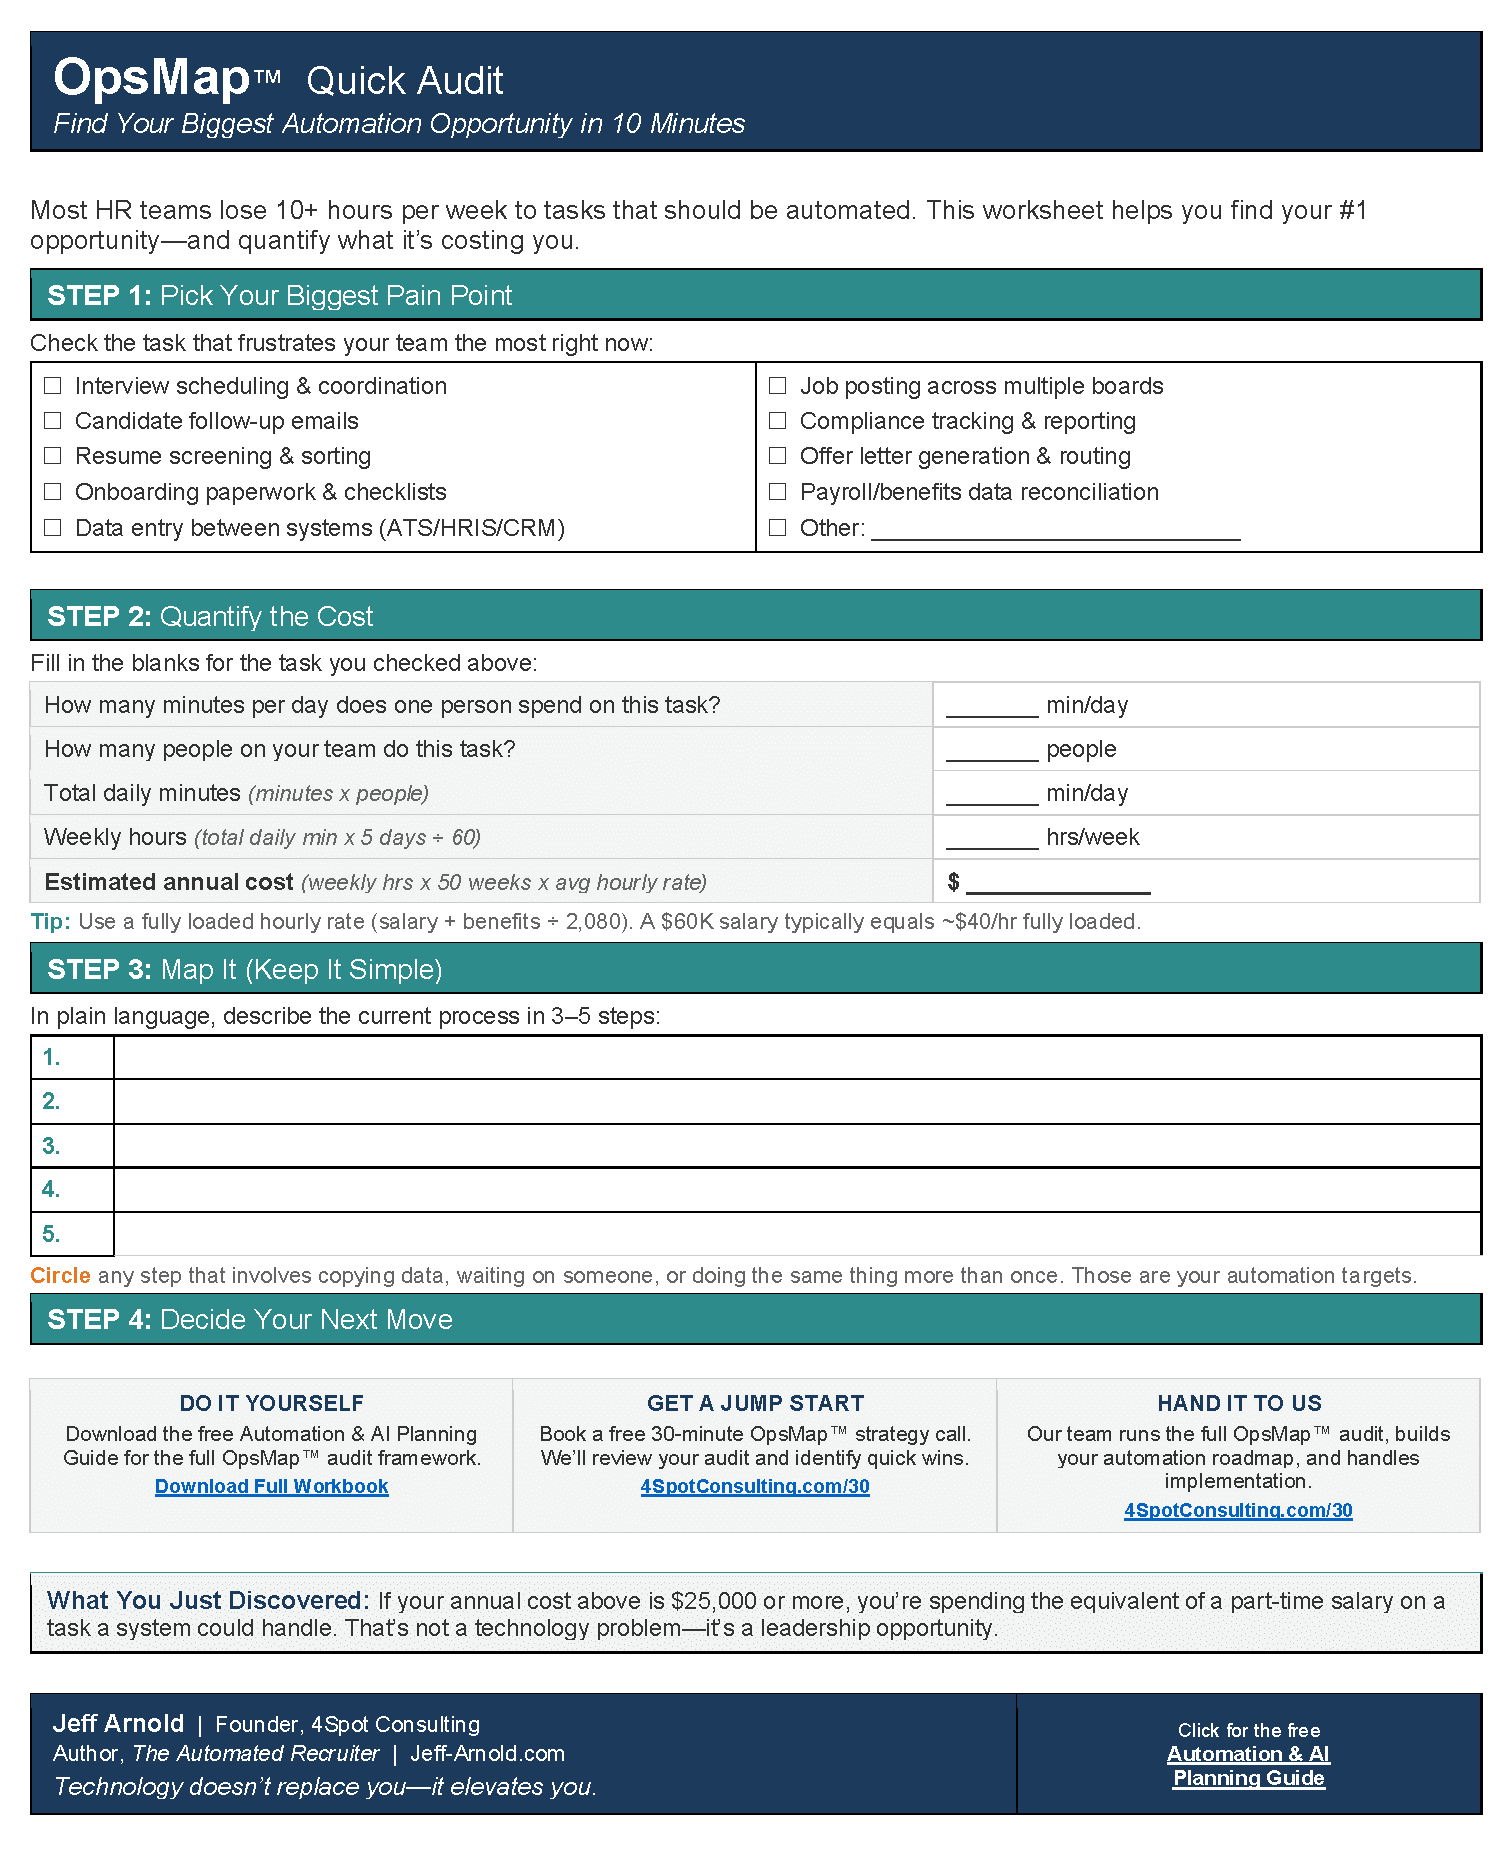
For a structured framework on how to audit sourcing operations before deploying analytics, see How to Run an OpsMap™ Audit Before Automating Anything.
Bottom line: Velocity indexing by channel gives you a role-urgency routing decision — not just a quality-vs-cost tradeoff.
Putting the Nine Tactics Together
These tactics are not independent interventions. They form a layered evidence infrastructure:
- Data foundation: Tactics 1 and 3 (attribution modeling + data quality) must be in place before any other analysis is reliable.
- Channel efficiency: Tactics 2 and 9 (cost-per-quality-hire + velocity indexing) give you the dimensions for channel comparison.
- Process diagnosis: Tactics 4 and 8 (funnel drop-off + diversity mapping) identify where your process is creating problems attribution cannot solve.
- Advanced intelligence: Tactics 5, 6, and 7 (predictive scoring, time-to-productivity, passive pipeline analytics) layer on top once the foundation is solid.
The sequence matters. Teams that skip to predictive scoring before fixing source tag completeness are building sophisticated analysis on corrupted data — a guarantee of confident wrong answers.
Expert Take
The most common sourcing analytics failure is not a lack of tools. It is a lack of data discipline at intake. Every dashboard, every model, and every channel comparison in this list is only as reliable as the source field in your ATS. Start there. Everything else follows.
For the operational framework that connects sourcing analytics to broader HR process design, see How Solo and Small HR Teams Can Fix Broken HR Operations and Practical AI for Recruitment: Real Impact and ROI Beyond the Hype.
Additional Reading
- AI-Powered Recruitment: A Step-by-Step Guide to Smarter Sourcing and Screening
- The AI Automation Advantage in Candidate Sourcing
- HRIS Required Fields vs. Manual Data Validation: Which Is Safer?
- How TalentEdge Saved $312K with HR Process Standardization
- Recruiting Automation: Transforming Hidden Costs into Measurable ROI
- How HR Can Fix Broken Hiring Processes
- AI and Automation: Unlocking Deeper Talent Pools Beyond CRM
- 9 EEOC AI Compliance Requirements HR Teams Must Meet in 2026
- How to Run an OpsMap Audit Before Automating Anything
- How Solo and Small HR Teams Can Fix Broken HR Operations
- Practical AI for Recruitment: Real Impact and ROI Beyond the Hype
- Accelerate Hiring: A Step-by-Step Guide to AI Candidate Screening
- 11 Warning Signs Your Inherited HR Operation Is Bleeding Money
- The $27K Overpayment: How One HRIS Data Entry Mistake Cost a Manufacturer a Year of Salary
- From Automation to Strategic AI: The Future of Modern Recruitment



RELATED POST